The data logger exports files in CSV format that may be easily imported and analysed in spreadsheet software such as Microsoft Excel.
Situation
The trend of a data point shall be made visible in a diagram. The logged data points in the export file are to be used to draw this diagram over time.
Solution
The data logger function of the icom Data Suite logs the desired value. An export file of this datalog will be created that contains the values. This export file is a tar.gz archive file, which contains a CSV file, which again is compressed using xz. This CSV file will be imported in Microsoft Excel. The basic functions of Microsoft Excel will be used to draw a graph.
The following is prerequisite to continue configuration:
-
You have a data logger export file
-
You have Microsoft Excel installed on your computer
-
You have a file archive program installed that is able to unpack xz, tar and Gzip such as 7-Zip for example
In this Configuration Guide, we use the file that results from this Configuration Guide.
Importing the CSV File in Excel
-
Open a file browser and locate the export archive file on your computer.
-
Use your file archive program to unpack the export archive file until you have the exported datalog in CSV format.
-
Start Microsoft Excel and open a new spreadsheet.
-
Change to the Data tab and click on From Text/CSV.
-
Select the unpacked CSV file in the Import Data window and open it.
-
Check the suggested import settings and click on Load.
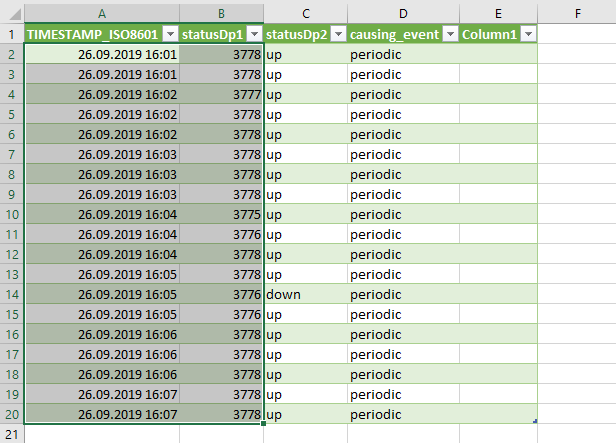
The logged data will be imported in Microsoft Excel.
Analysing the Data in Excel
-
Highlight the columns with the timestamp and the supply voltage except the heading.
-
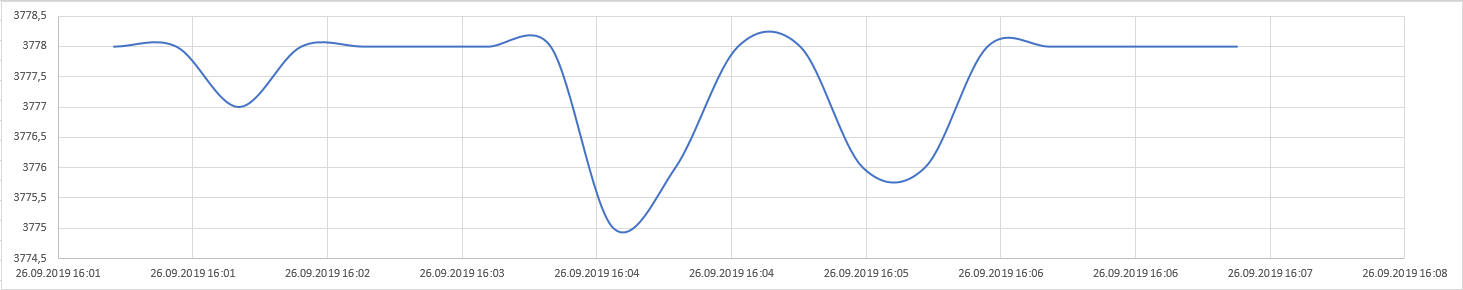
Change to the Insert tab, click on Scatter and select one of the scatter graphs with lines.
The supply voltage will be drawn as a graph over time.
Back to the Configuration Guides for the icom Data Suite
Back to overview