Pre-installed application - functional test
The pre-installed application has various interacting functional elements. The read Modbus values and the count are provided to an MQTT broker, the counter can be manipulated by using digital inputs and MQTT. All values and conditions are indicated on the Dashboard. The following demonstrates how to test the functions of the application and see the results of your actions simultaneously.
Preparation
You should install an MQTT client on your computer and wire the digital inputs of the router via a push-button.
MQTT client
This example describes how to install the free MQTT client MQTTBox and configure it for the test. You can also use an existing MQTT client or install and use any MQTT client. To do this, proceed according to this description.
-
Download MQTTBox here and install the client.
-
Open MQTTBox, click on Create MQTT Client and make the following settings:
-
MQTT Client Name: HiveMQ (example)
-
Protocol: mqtt / tcp
-
Host: broker.hivemq.com:1883
-
-
Click on Save to save the client settings.
The client connects to the broker automatically and should display Connected on green background now.
You have completed the installation and configuration of the MQTT client with this. The definition of the publishers and subscribers follows in the Test section.
Digital inputs
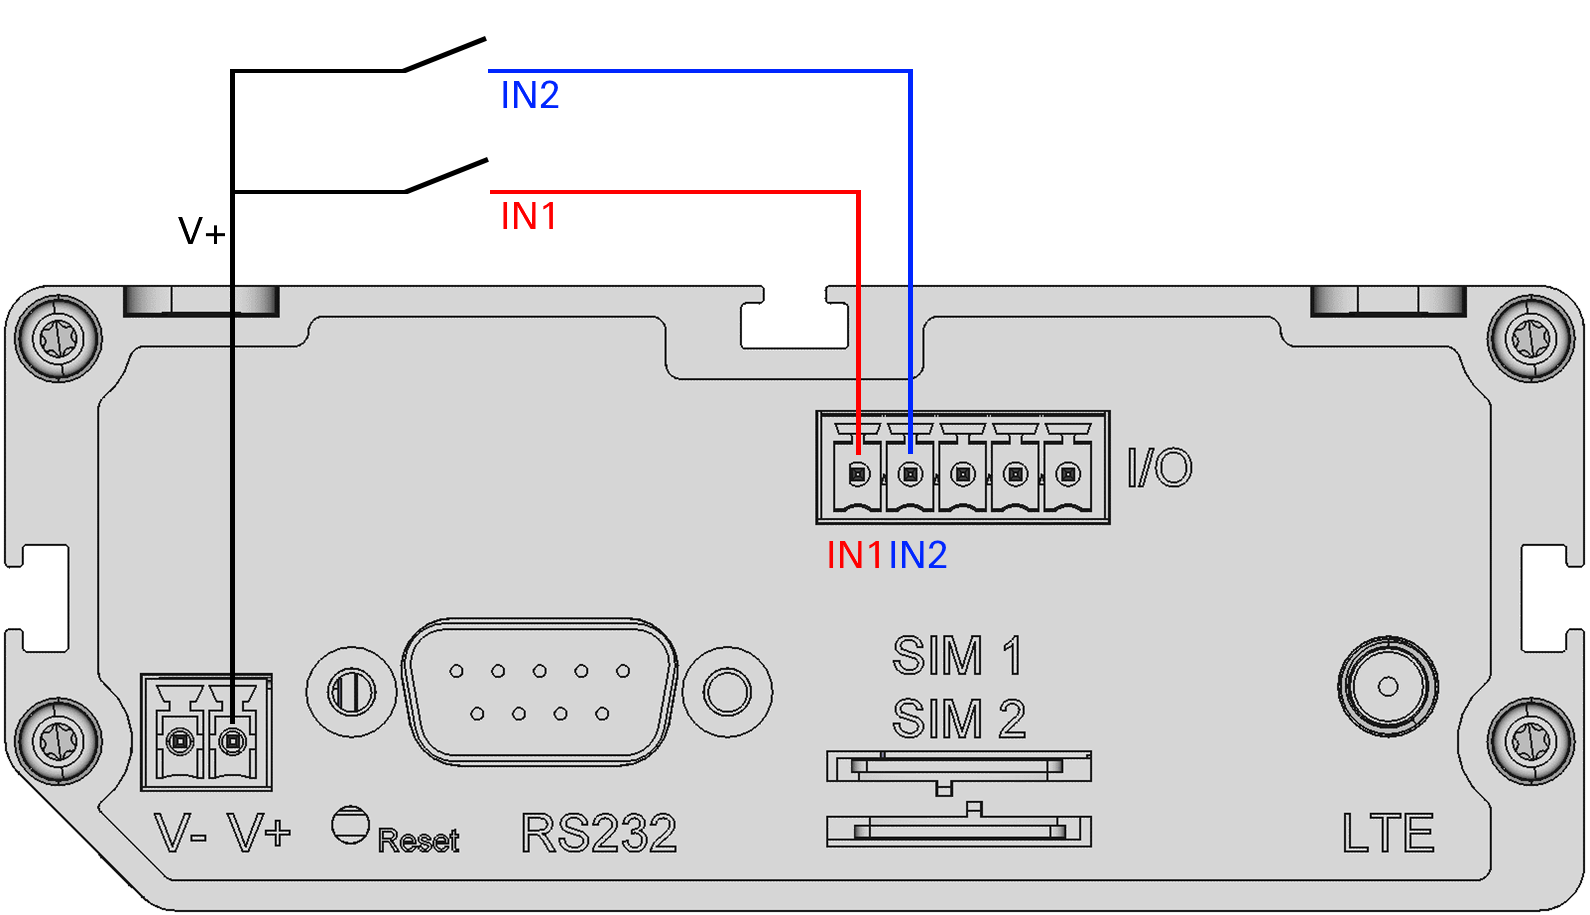
Both digital inputs of the router are required for the test. Connect the digital inputs IN1 and IN2 via a push-button to V+ as shown in the following diagram:
Test
The test is especially informative, if both, the Dashboard and the MQTT client, are opened on the computer simultaneously.
Dashboard
The Dashboard is part of the icom Data Suite. It indicates a series of interesting values and parameters of the pre-installed application.
-
Enter the address https://192.168.1.10 in a web browser and open the web interface of the icom Data Suite (see here).
-
Login using the default credentials Name: insys and Password: icom.
-
In the Status menu, click on Dashboard to open the Dashboard in a new browser tab.
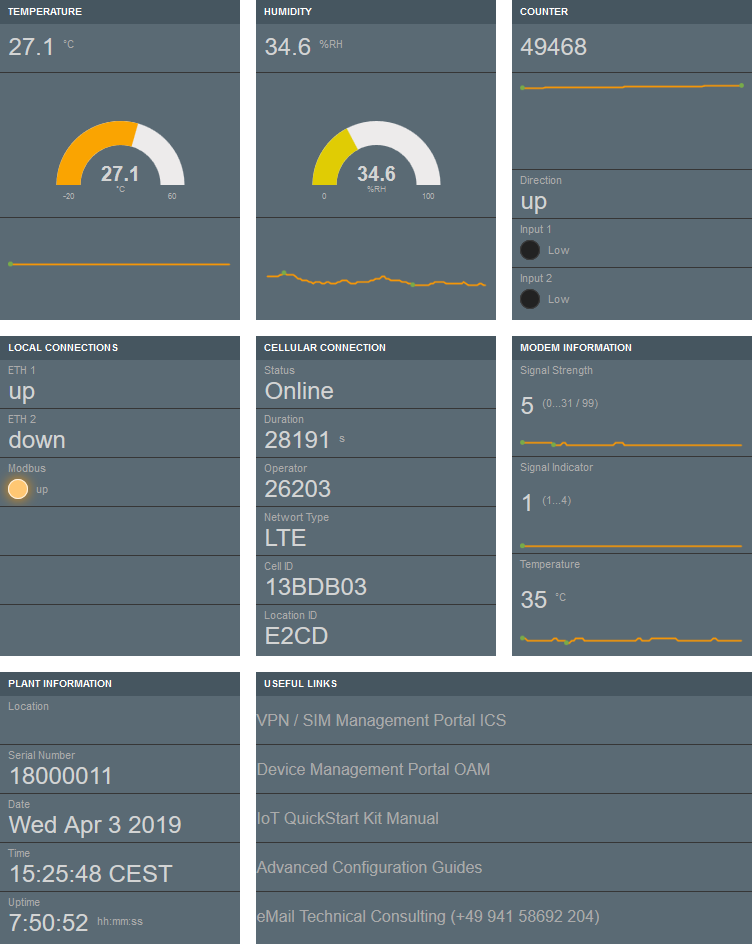
The Dashboard shows (from left to right and top down) the following panes:
-
TEMPERATURE pane, with the widgets temperature as text, as gauge and as sparkline
-
HUNIDITY pane, with the widgets humidity as text, as gauge and as sparkline
-
COUNTER pane, with the widgets counter value as text and sparkline as well as the condition of the running direction as text and the two digital inputs as indicator lights
-
LOCAL CONNECTIONS pane, with the widgets for the condition of the two Ethernet ports as text and the condition of the Modbus connection as indicator light
-
CELLULAR CONNECTION pane, with the widgets for the cellular conditions connection status, duration, network operator, network type, Cell ID and Location ID as text
-
MODEM INFORMATION pane, with the widgets for the condition of the signal strength, the signal indicator and the temperature of the cellular engine, each as text with sparkline
-
PLANT INFORMATION pane, with the widgets for the system status values of the router for location, serial number, date, time and uptime as text
-
USEFUL LINKS pane, with the widgets about useful web sites as HTML links
All above mentioned values and conditions can be viewed on the Dashboard directly during the test.
| The Dashboard has an update interval of 5 s by default. Please consider this when observing the responses of the Dashboard upon your actions. |
Digital inputs
The digital Input IN1 permits the control of the running direction of the control and IN2 permits to reset the counter (see here).
-
Press the push-button on digital input IN1 and observe on the Dashboard in the COUNTER pane how each actuation changes the running direction or stops the counter.
-
Press the push-button on digital input IN2 and observe on the Dashboard in the COUNTER pane how the counter is reset to zero.
MQTT publish
Publishing certain topics permits the control of the running direction of the control and to reset the counter (see here).
-
Open MQTTBox and select the HiveMQ client (if not already selected).
-
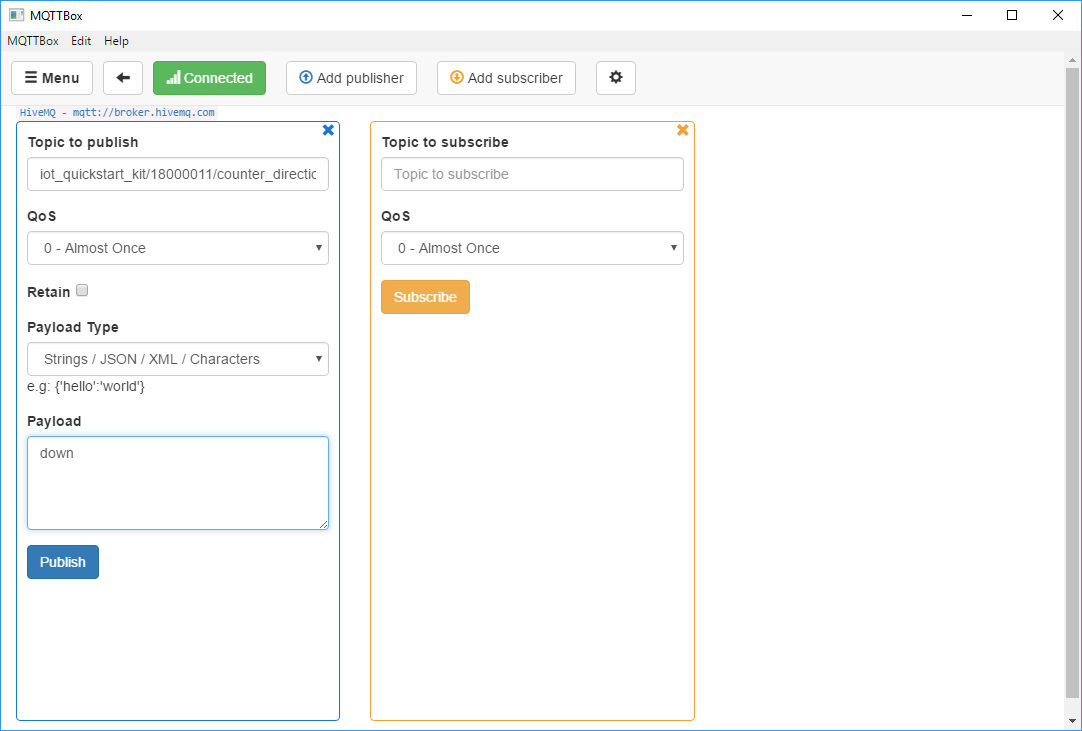
Refer to the already added publisher field and configure the publisher as follows:
-
Topic to publish: iot_quickstart_kit/$(SERIALNUMBER)/counter_direction (the wildcard $(SERIALNUMBER) must be replaced by the serial number of the router)
-
Paylod Type: Strings / JSON / XML / Characters
-
Payload: down
-
-
Click on Publish and observe on the Dashboard in the COUNTER pane how the running direction changes.
-
Continue to send the payloads up, stop and down by turns and observe on the Dashboard in the COUNTER pane how the running direction changes.
-
Send the payload reset to the topic iot_quickstart_kit/$(SERIALNUMBER)/counter (replace serial number!) and observe on the Dashboard in the COUNTER pane how the counter is reset to zero.
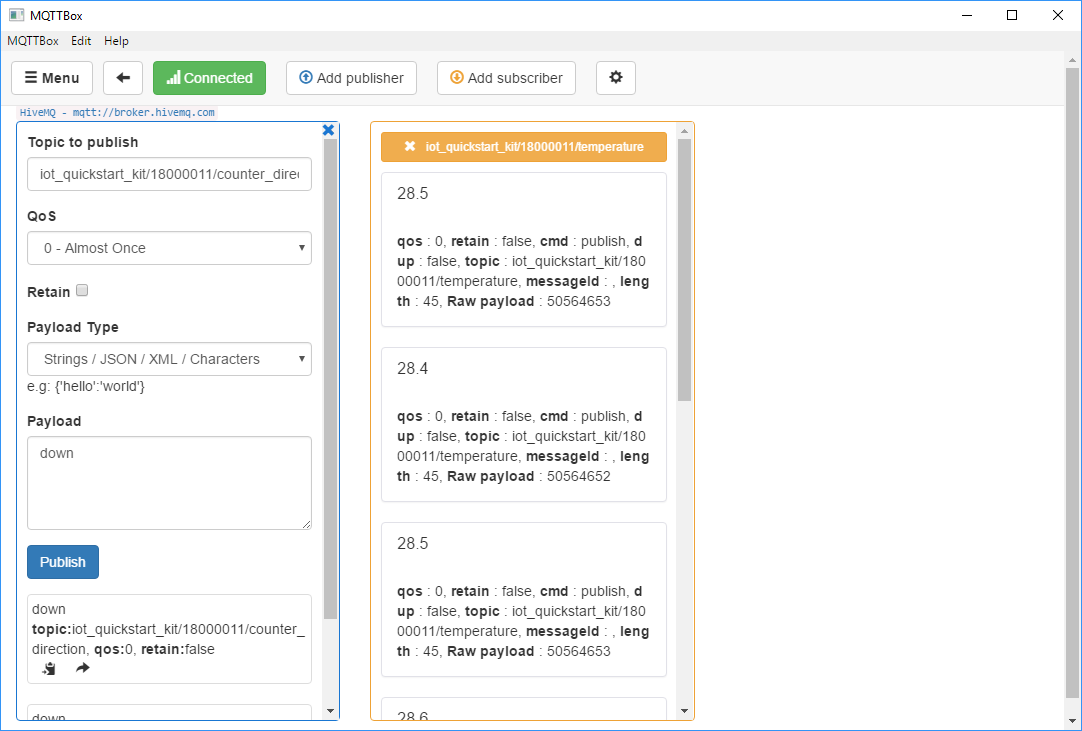
MQTT subscribe
The application transmits the values for temperature and humidity as well as the count to the MQTT broker regularly (see here). These can be subscribed by an MQTT client.
-
Open MQTTBox and select the HiveMQ client (if not already selected).
-
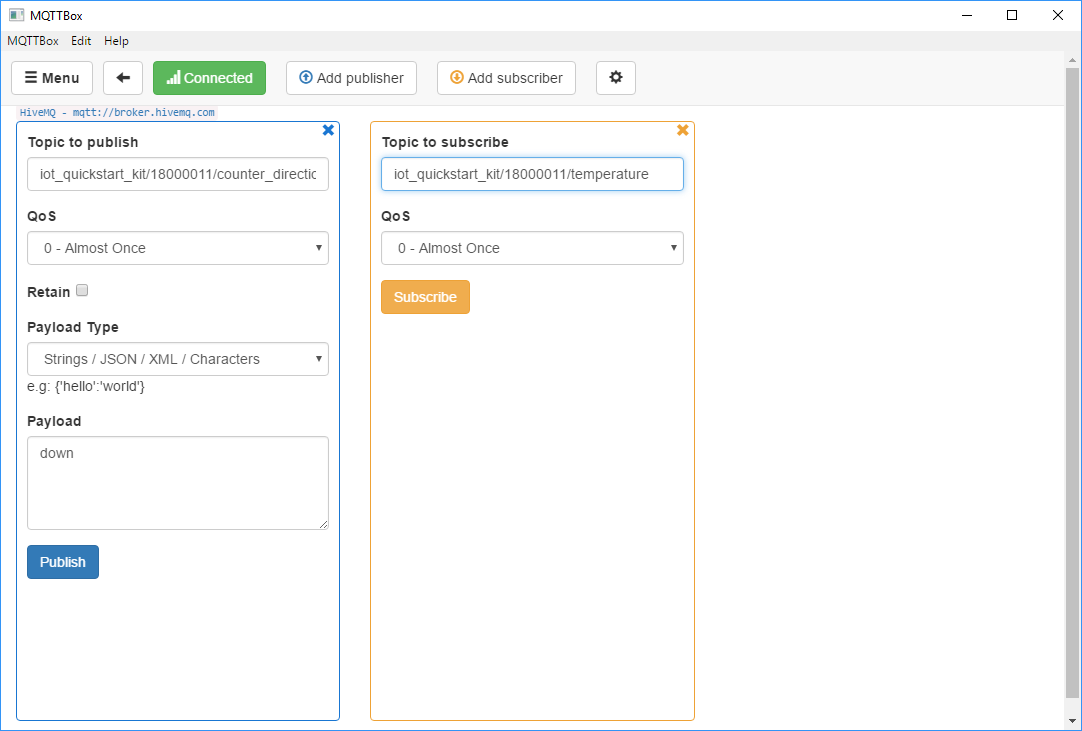
Refer to the already added subscriber field and configure the subscriber as follows:
-
Topic to subscribe: iot_quickstart_kit/$(SERIALNUMBER)/temperature (the wildcard $(SERIALNUMBER) must be replaced by the serial number of the router)
-
-
Click on Subscribe and observe how the values arrive in the MQTT client.
-
Continue to subscribe the topics iot_quickstart_kit/$(SERIALNUMBER)/humidity and iot_quickstart_kit/$(SERIALNUMBER)/counter (replace serial number!) and observe how the values arrive in the MQTT client.