Extending the Dashboard
The Dashboard is part of the icom Data Suite. It already indicates a series of interesting values and parameters of the pre-installed application. It can be extended quick and easy by further values and parameters.
-
Enter the address https://192.168.1.10 in a web browser and open the web interface of the icom Data Suite.
-
Login using the default credentials Name: insys and Password: icom.
-
In the Status menu, click on Dashboard to open the Dashboard in a new browser tab.
-
In the top center of the Dashboard, click on to display the Dashboard menu.
-
Click on ADD PANE to add another pane on the Dashboard.
-
In the new pane, click on and specify the title under TITLE and the column width of this field under COLUMNS.
-
In the new field, click on to add a new widget on the pane.
-
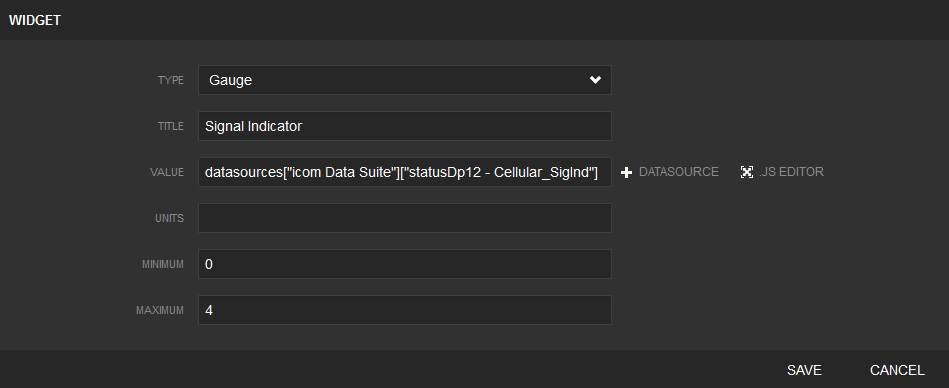
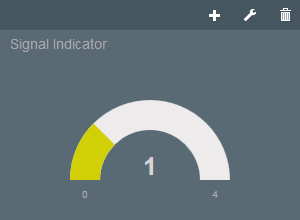
Define the display type and the data source to be displayed accordingly for the widget. The followinf widget configuration shows the signal quality of the cellular connection (reception bars) as gauge display for example.
-
Drag the newly created pane to the desired location on the Dashboard using Drag & Drop.
| The configuration of the already existing widgets can be used as an example for further information about the available widgets and their configuration. For further information to this, refer to the online help of the icom Data Suite. |
| The widgets also provide a JavaScript editor. This permits simple conversions of values for a direct display. An example for this is on the COUNTER pane the Direction widget. Click in this widget on and .JS EDITOR to see the code for converting the flag values into text. |
-
Click on SAVE DASHBOARD to save the modification on the Dashboard.
-
Click on ACTIVATE PROFILE to activate the modifications on the profile (of the configuration) of the icom Data Suite, that have been made with the Dashboard modifications.
-
To finish the modifications on the Dashboard, click on in the top center to hide the Dashboard menu.
You have adjusted the Dashboard for your requirements with this.
Result testing
-
Reload the page in the browser tab with the Dashboard (Ctrl+F5) to see, whether the new field is displayed as desired.